Gap Up Gap Down Trading
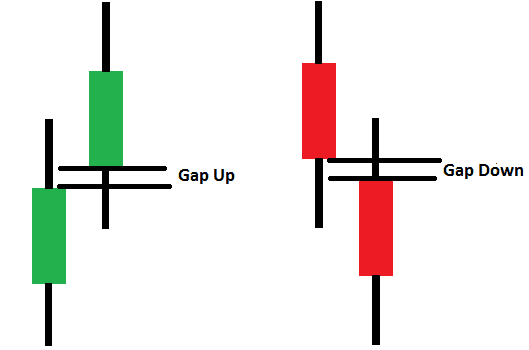
Gap Up and Gap Down
We will try to analyse what should be our directional view for intra-day trades when market gaps up/down.
Generally, when the market gap's up we expect to see there's a bullish view on stock and similarly for gap down a bearish view.
Keeping that in mind let's pick PNB stock for this analysis and lets try to see how the share price performed in a day during gap up/gap down days.
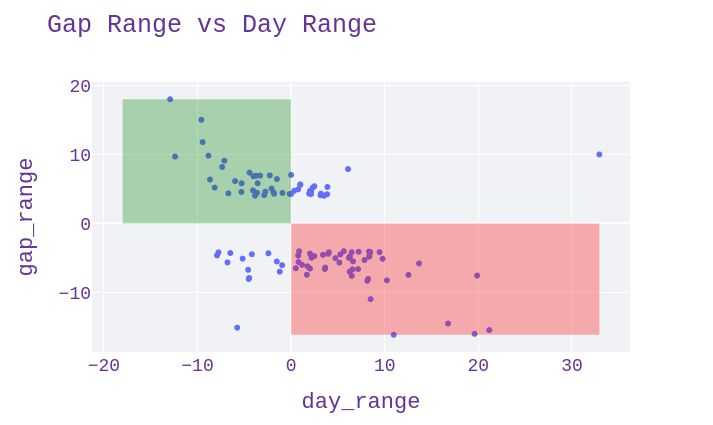
This graph tells movement of shares price in a given day when there's a gap up/down of more than 4%.
We can observe that most of the days are concentrated in two areas covered in rectangles.
Surprisingly, we can see there's inverse relation. If there's a gap up we can see day ended in loss that appears in the Green rectangle. Similarly if there's a gap down we can observe day ended high as observed in Red rectangle.
To make more sense consider the day when there was the highest gap-up i.e on 2002-07-15 @18% if we observe the day went down by -12.92% 😲. If a trader with bullish view takes a long call then he would have definitely hit loss 😭.
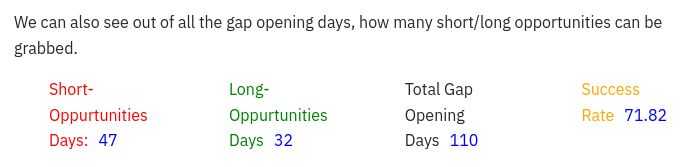
Therefore it is suggested to, preferably take reverse calls whenever there's a gap up/down i.e, taking short and long calls respectively. ❗(Not an advisory)
We can also see out of all the gap opening days, how many short/long opportunities can be grabbed.
For doubts, questions or want to know Elon Musk's next tweet on bitcoin, reachme out on twitter: @143akhi
Click below on streamlit for an interactive tour of the above strategy.
![]()