Checking performance of Home Internet 🚀
Speed Test
I have recently subscribed to a new ISP(Internet Service Provider) for upgrading my Internet Speed Download and Upload Speeds to 150Mbps. During the first week the speed was good but slowly the service from the ISP started deteriorating. The speeds were varying drastically and currently it's hovering around 77Mbps for downloads and 30Mbps for Uploads.
The ISP would increase the speeds, whenever I complain them. But after some time again they decrease. Recently, I've started going to www.speedtest.net website regularly to keep a tab on the speeds. But it's very painful to repeatedly open the site and test the internet speeds. Therefore I've created an Internet Speed Test App hosted it on Raspberrypi that runs every Hour. The results are recorded into Airtable and visualized in a graph.
How to build it ?
I built the App using Rustlang 🦀. I've cross-compiled the application to Raspberrypi model 1 executable using raspi_tools.
I've tried to build the App from scratch but the results weren't true to the speedtest.net results. I stopped working on it as my objective was to get an app that can push speedtest results to Airtable. Using speedtest-cli from Ookla I was able to fork the speedtest app from Rust and obtain the results. Here's how I made it.
As I'm running on ubuntu I've installed the speedtest-cli from this link. After Installing test it by running speedtest command from terminal. 
Create Airtable Account
Create an Airtable Account and create a base. 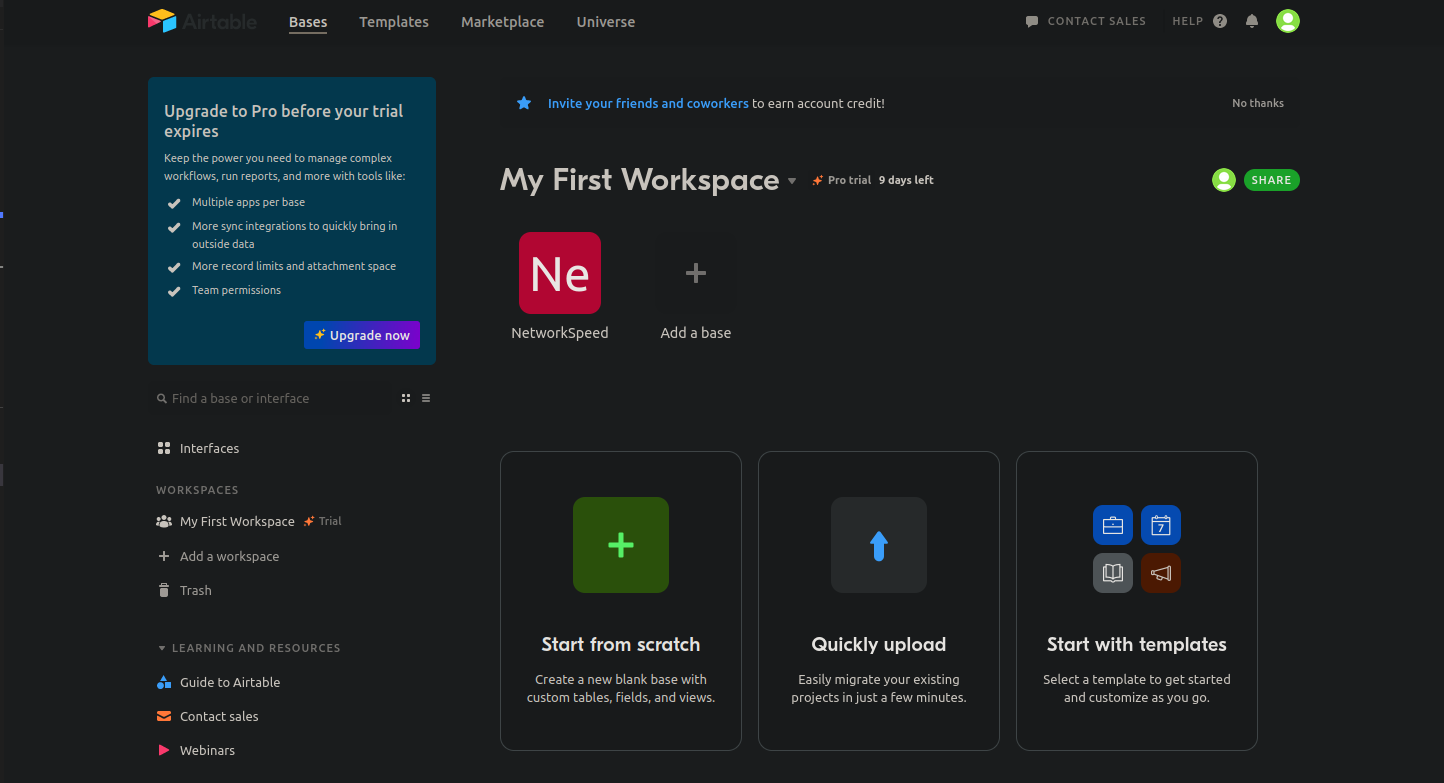
Goto Account Overview and get the API KEY to insert speedtest records into Airtable. Also fetch the base ID of the table
from rest API docs 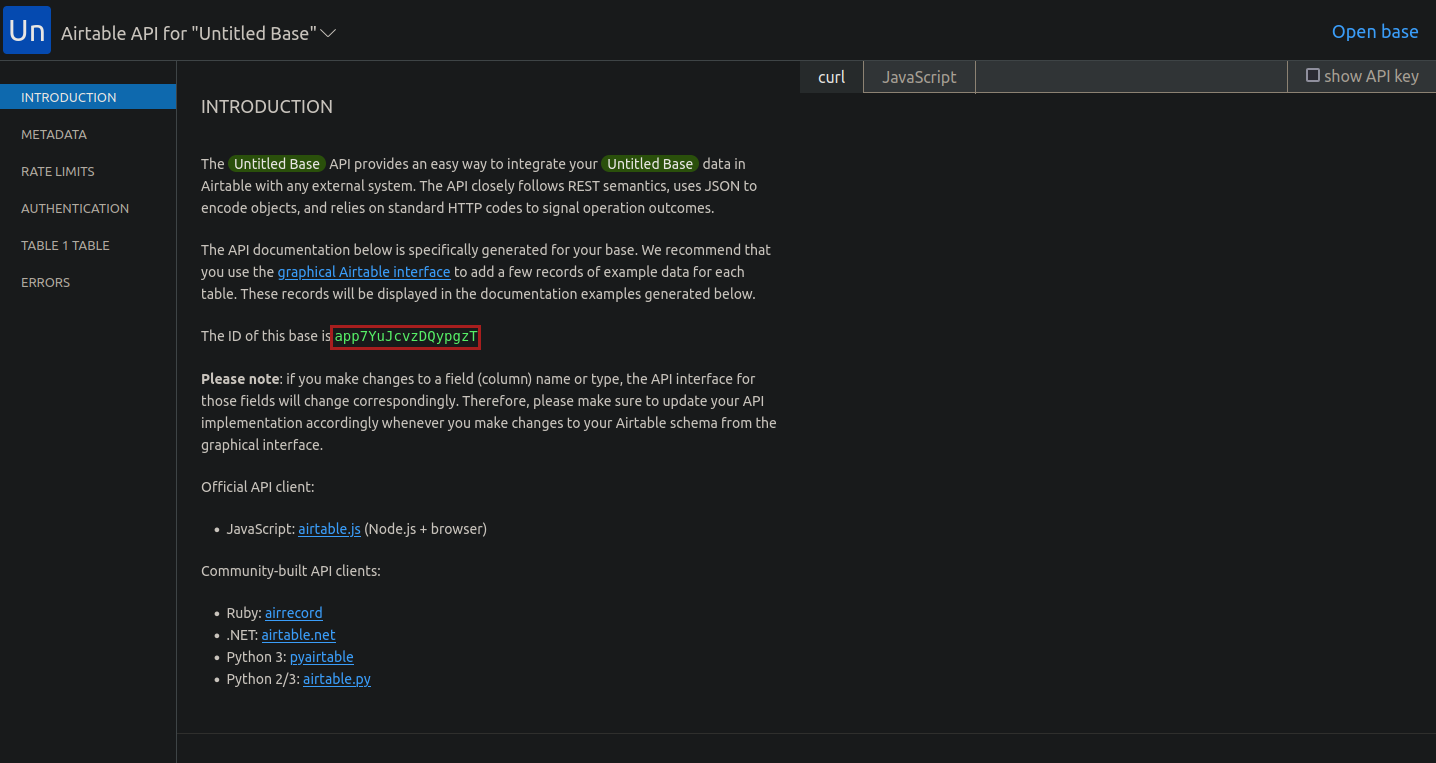
TestRun speedtest in local machine
Git clone the speedtest repo and run below command to check if speedtest and insertion works properly
Please refer to https://rustup.rs/ for installing Rustlang along with Cargo.
env AIRTABLE_BASE_ID=xxxxx AIRTABLE_AUTH_KEY=xxxxxxxx cargo run
Speedtest will be run followed by insertion of results into the Airtable. Verify the results in the table. 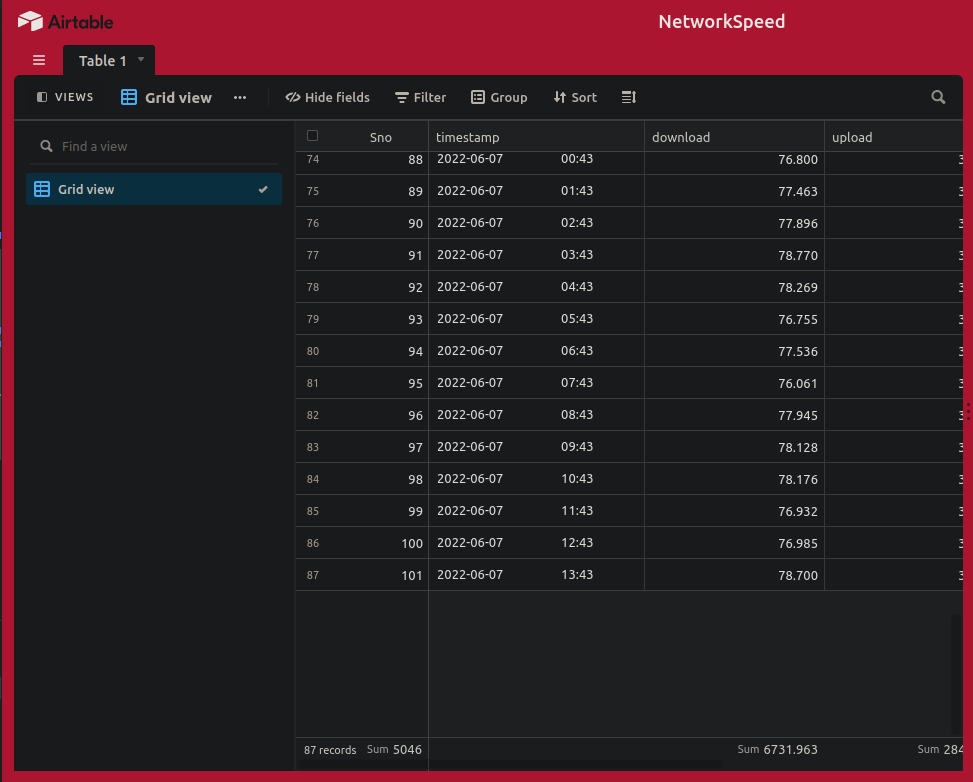
Raspberrypi Setup
After everything goes well! #emoji. It's time to build the app for Raspberrypi.
Connect to Raspberrypi from terminal and install, extract the speedtest-cli application
curl https://install.speedtest.net/app/cli/ookla-speedtest-1.1.1-linux-armhf.tgz -o speedtest.tgz

tar zxvf ookla-speedtest.tgz -C ./ookla
Run the speedtest command to test if it's running in Raspberrypi
ookla/speedtest
Cross Compiling from local machine to build an executable for Raspberrypi
After the test run, let's cross compile speedtest to raspberrypi to be compatible. Let's setup few dependencies for cross compilation in Ubuntu.
git clone raspi_tools and set the path of linker present in the folder at ~/.cargo/config as
[target.arm-unknown-linux-gnueabihf]
linker = "<parent-path>/tools/arm-bcm2708/arm-rpi-4.9.3-linux-gnueabihf/bin/arm-linux-gnueabihf-gcc"
Also rust should know the target architecture of the raspberrypi. Let's add by running below command.
rustup add arm-unknown-linux-gnueabihf
Add Raspberrypi's ip-address in deploy.sh.
readonly TARGET_HOST=<user>@<ip-address>
Installing in Raspberrypi and setting up Cron Job
Run the deploy.sh file after the changing the Ip-Address. It runs the cargo build command and generates the executable suitable to run on raspberrypi. After which it pushes the executable to Raspberrypi using rsync.
Validate that the executable is present in raspberrypi at the path /home/pi/speedtest. Run the executable as below to verify the records are inserted into Airtable.
env AIRTABLE_BASE_ID=xxxxx AIRTABLE_AUTH_KEY=xxxxxxxx /home/pi/speedtest
If everything works good, speedtest records are inserted into Airtable and now we can setup a Cron Job.
To setup cron job for every one hr at 43rd minute open the crontab file by running crontab -e and write below lines.
AIRTABLE_BASE_ID=xxxxxxx
AIRTABLE_AUTH_KEY=xxxxxxxxx
PATH=/home/pi/ookla:$PATH
43 */1 * * * /home/pi/speedtest >> /home/pi/speedtest.log
Visualizing the Dashboard in Airtable
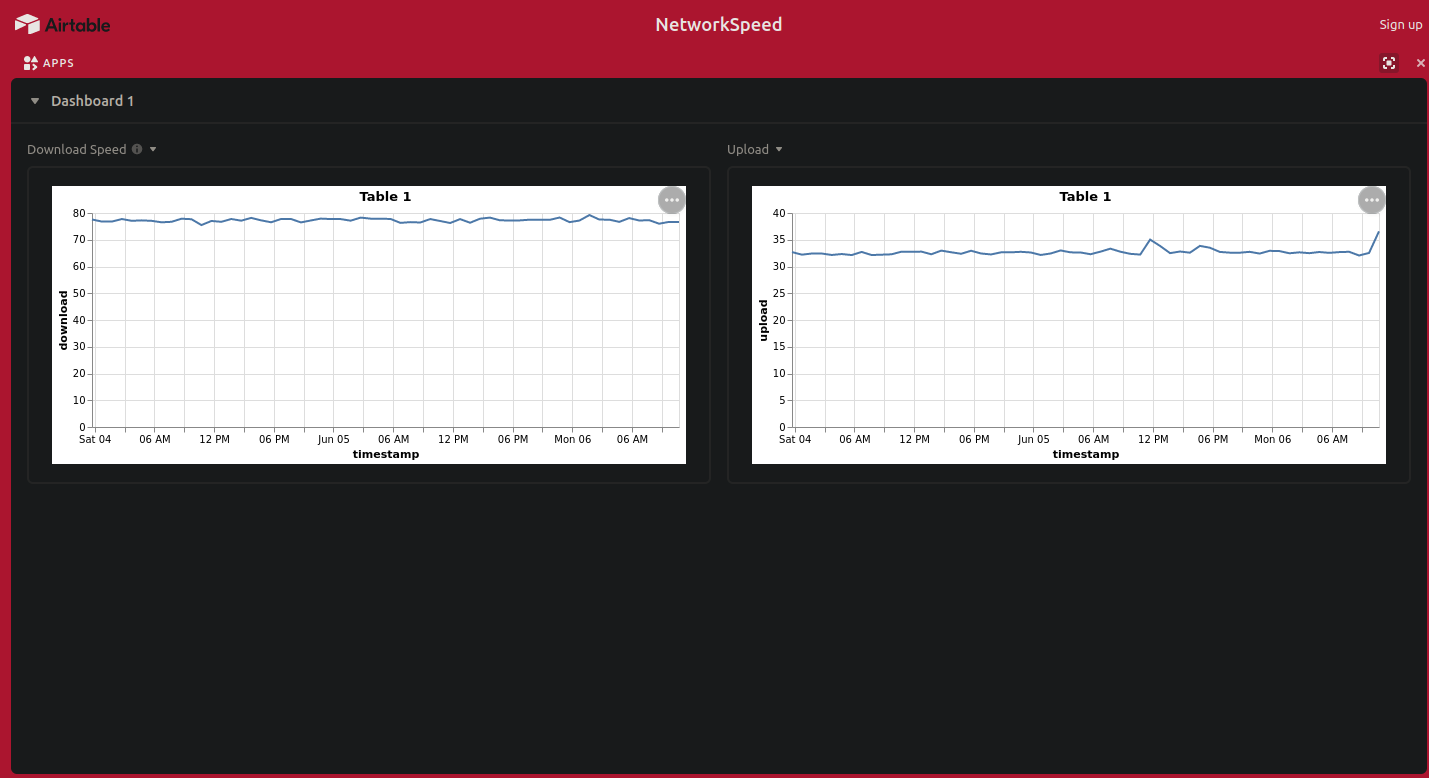
It's Done! The speedtest is run every one hr on raspberrypi and results are recorded in the Airtable. It's dull and boring to see all the records in a table. Let's visualize it in a graph.
Goto App Sections in the Airtable and click on Add an App. From there search for Vega-Lite app to add it.
Select the table from the drop down after adding and paste the below json to visulaize the download data.
{
  "$schema": "https://vega.github.io/schema/vega-lite/v4.json",
  "title": "Table 1",
  "width": "container",
  "height": "container",
  "mark": "line",
  "encoding": {
    "x": {
      "field": "timestamp",
      "type": "temporal"
    },
    "y": {
      "field": "download",
      "type": "quantitative"
    }
  }
}
Repeat the same step i.e, adding an app for visualizing the upload speed column and change the y-field to upload.
Yipee Here we have the Dashboard visualizing the Results.
Currently my home network's Internet Speed Graph's can be seen here:
📫 How to reach me
I'm always active on Twitter. You can follow me at
